| V Colloquium Chemiometricum Mediterraneum Ustica (PA), Sicily, Italy, Europe 25-27 June 2003 |
Dr. Giovanni Visco from Prof. L. Campanella Research Group |
Italy, Rome University La Sapienza Chemistry Department |
| previous slide | next slide, 33 |
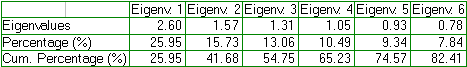
Using only ten variables we obtain the following table of variance's distribution and the values of eigenvectors.
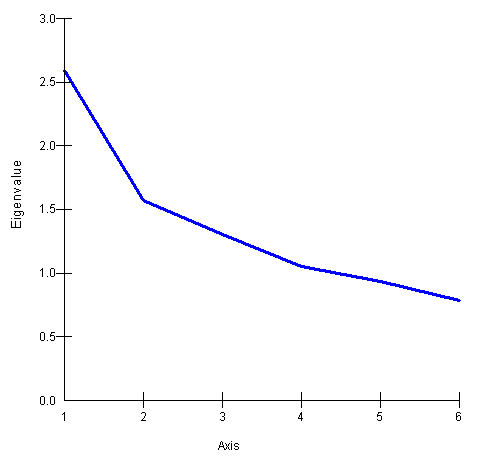
The Scree Plot, constructed by simply plotting the eigenvalues in decreasing order, produces a line graph showing their importance order.
| previous slide | next slide |