| V Colloquium Chemiometricum Mediterraneum Ustica (PA), Sicily, Italy, Europe 25-27 June 2003 |
Dr. Giovanni Visco from Prof. L. Campanella Research Group |
Italy, Rome University La Sapienza Chemistry Department |
| previous slide | next slide, 26 |
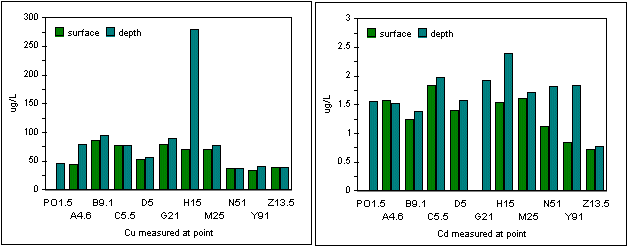
Just as an example we report the copper and cadmium concentration (the only metals with values always different from zero) found in all the sampling points.
For each point the surface and the maximum depth in the water column are reported.
The X axis scale is ordered as a function of the distance by the coast. A comparison with values obtained for "Porto Nuovo of Ostia" sample (1.5 m depth) can be also done
No univocal trend is evidenced as a function of the distance from the coast while a higher concentration in the deeper point with respect to the surface seems to be enough systematic for those metals.
| previous slide | next slide |